ICON Data Reports is a tool developed by the University of Iowa that fills a gap in ICON’s grade reporting features. It currently provides two utilities Discussion Reports and Grade Distributions. Discussion Reports shows instructors data on students replies/posts, and Grade Distributions allows instructors to generate histograms for multiple assignments/exams at a time. Data in these reports may be up to two days old. It also provides instructors with a way of sharing this data with students through ICON.
Get ICON Data Reports
- Log in to ICON and open your course.
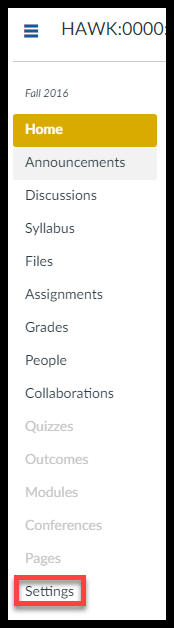
- Click on Settings in the toolbar on the left of the screen.
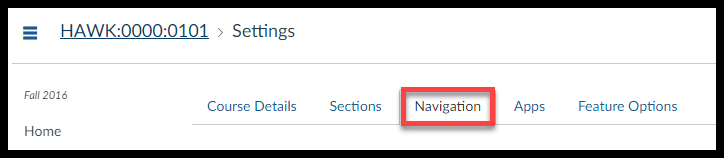
- Select the Navigation tab at the top of the screen.
- Click on the Gear Icon next to Canvas Data Reports and select Enable.
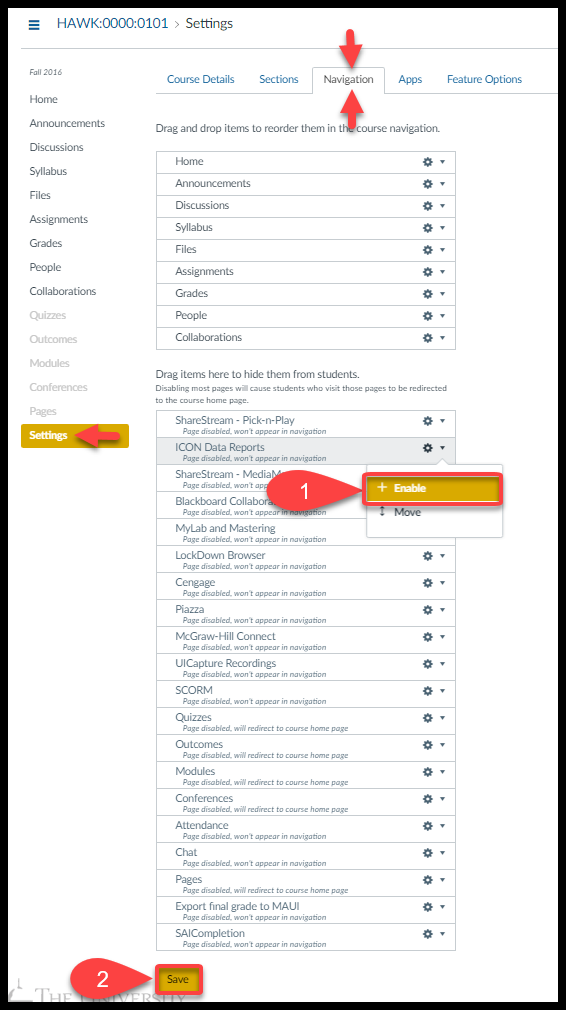
- Scroll to the bottom and click Save. You have now added ICON Data Reports to your course.
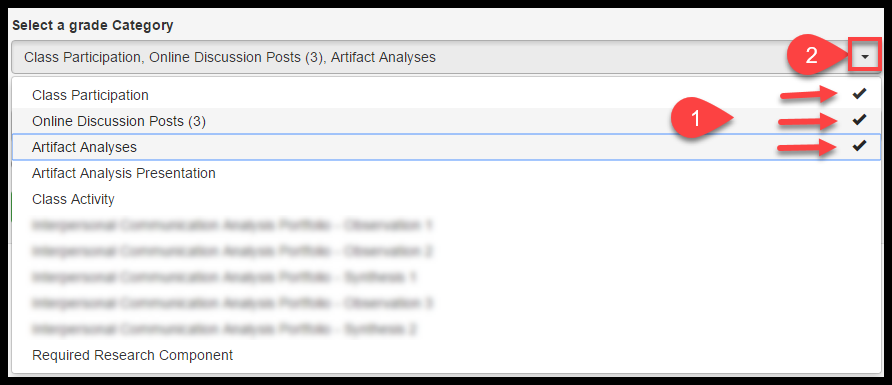
Select Multiple Categories
You can select more than one item in the drop-down menu. Items selected are denoted with a check mark to the right of them. Once you have made a selection, click on the icon in the top right of the drop-down menu.
Discussion Report
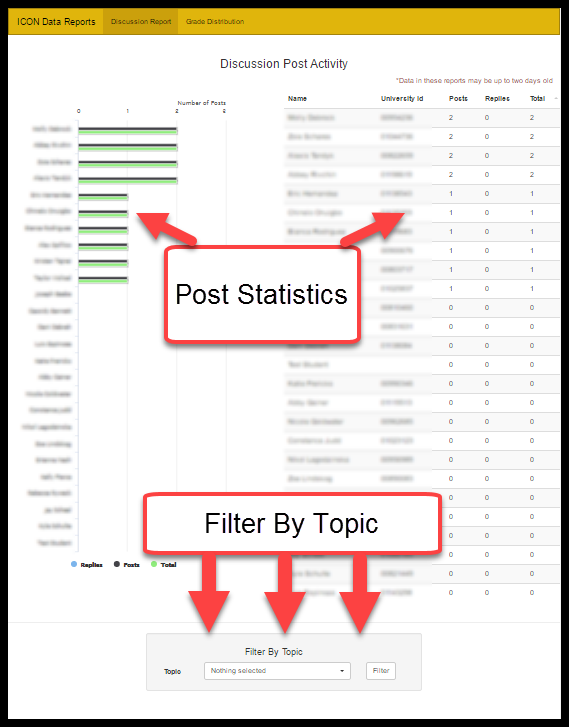
This feature of ICON Data Reports displays discussion statistics in terms of replies and posts per student. By default, this page shows statistics from all discussions, but you can opt to change that by using the Filter By Topic menu at the bottom of the page. Statistics on these reports may be up to two days old.
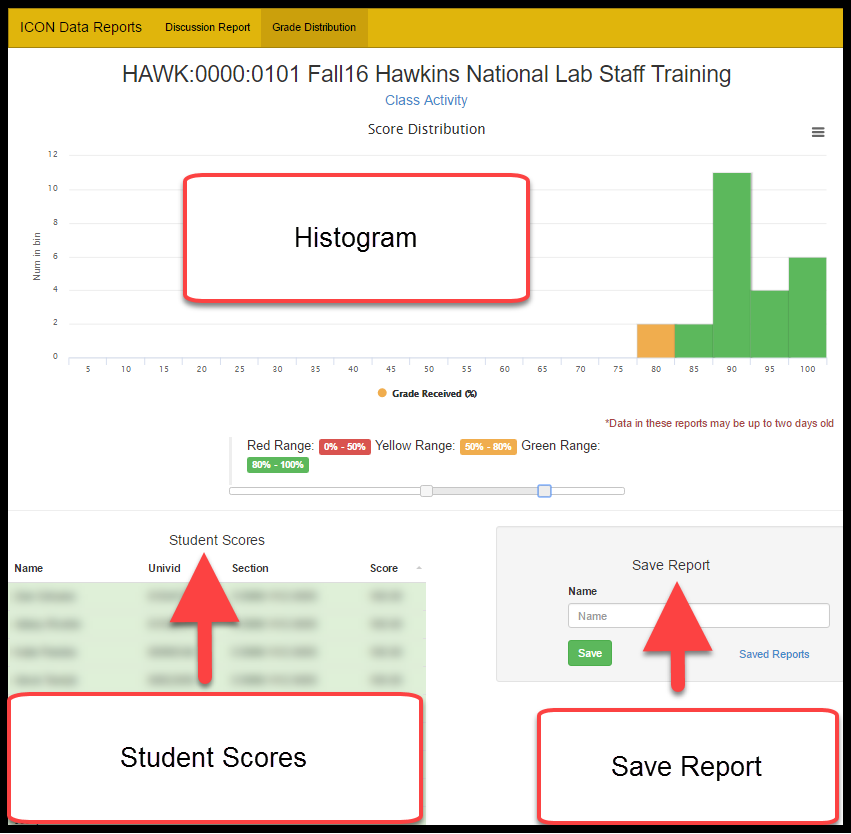
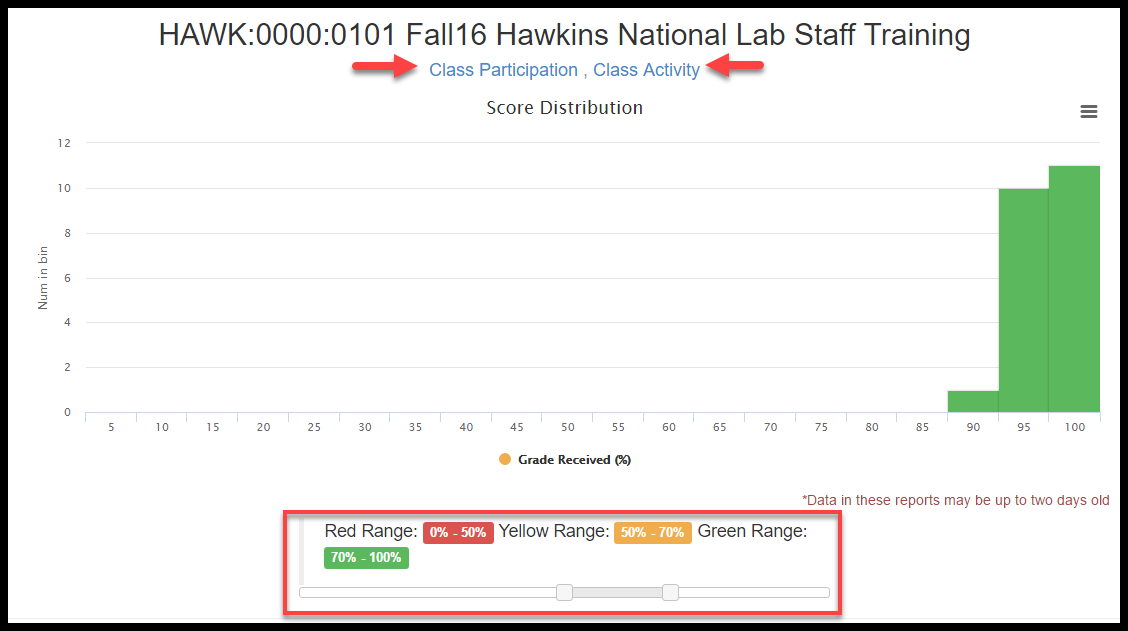
Grade Distributions
Data in this report can be up to two days old.
Generating a Report
- Select the appropriate Assignment(s) and Section(s). Then click the Submit button.
- Make sure to choose whether to include ungraded assignments into the Grade Distribution.
- Ignore Ungraded: this will cause all student scores that have not yet been inputted to be ignored when generating statistics.
- Treat ungraded as 0: this will cause all ungraded scores to count as zero.
- You can use the sliders at the bottom to select bounds for Red/Yellow/Green regions of the histogram. All assignments the graph is built from are shown on top of the histogram. By clicking on an assignment's name you are able to view statistics for only that assignment.
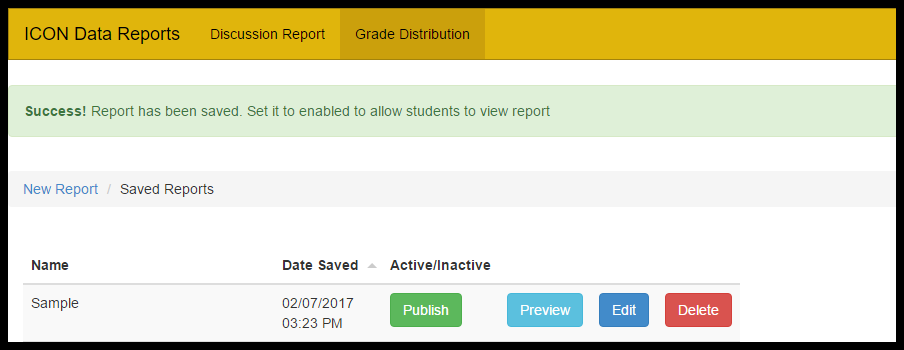
Saving a Report
- Below the histogram, name your report and click on the Save button. You may have to scroll down the page a little bit to see it.
- You can activate the saved report or allow students to view the histogram.
- Activate: allows students to view the saved report.
- Deactivate: stops students ability to view the saved report.
- Preview: displays a student view of the report.
- Delete: deletes the report.
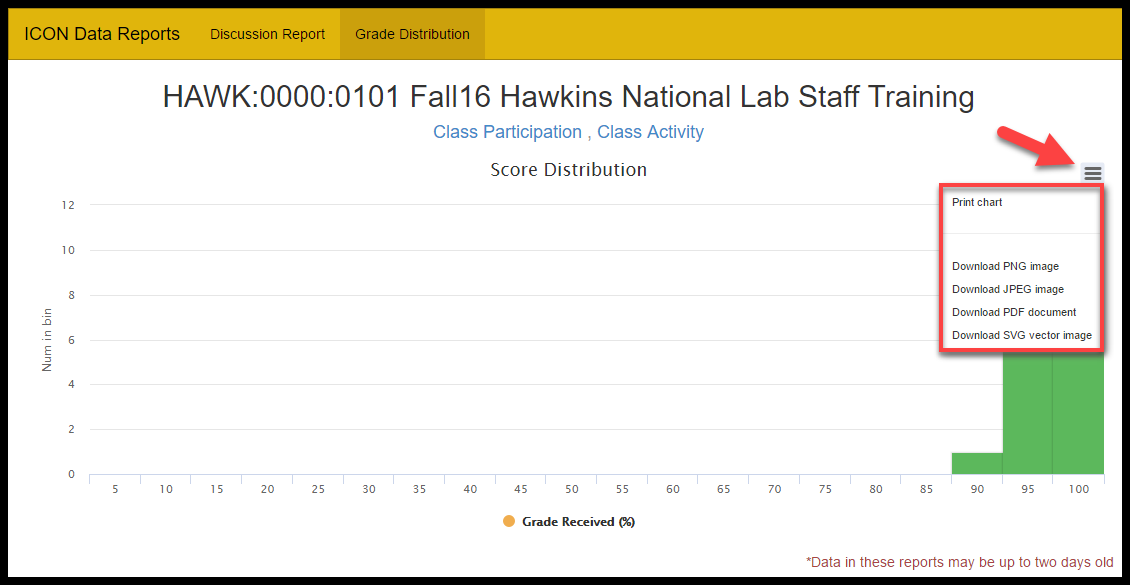
Downloading a histogram
You can download or print the histogram by selecting the menu icon in the top right of the screen. Currently, only printing will keep the color regions of the histogram. Downloading the histogram will change all of the bars to the same color.
