About the Ally Data Dashboard
The Ally Accessibility Data from ICON dashboard reports on the accessibility status of course materials in ICON to provide a clear view of how well department courses meet accessibility standards.
This dashboard highlights content that may present barriers to students such as untagged PDFs, images missing alt text, or low-contrast visuals. This visibility allows campus leaders to support instructors in proactively addressing issues, aligning with institutional goals and federal mandates.
Important to Note
Access to this information is restricted to areas within ICON that are allowed by your role on campus.
To request access, fill out the online form. Your request will be sent via Workflow for approval. This process will take 24-48 hours. Please contact the ITS Help Desk with any questions.
WYSIWYG, or What You See Is What You Get, refers to the pages, announcements, assignments, and quizzes that are inside an ICON course.
Ally only scans ICON sites with content. This can cause the number of courses in the Ally dashboard to differ from the number of courses in MAUI.
Dashboard Tabs
Overview
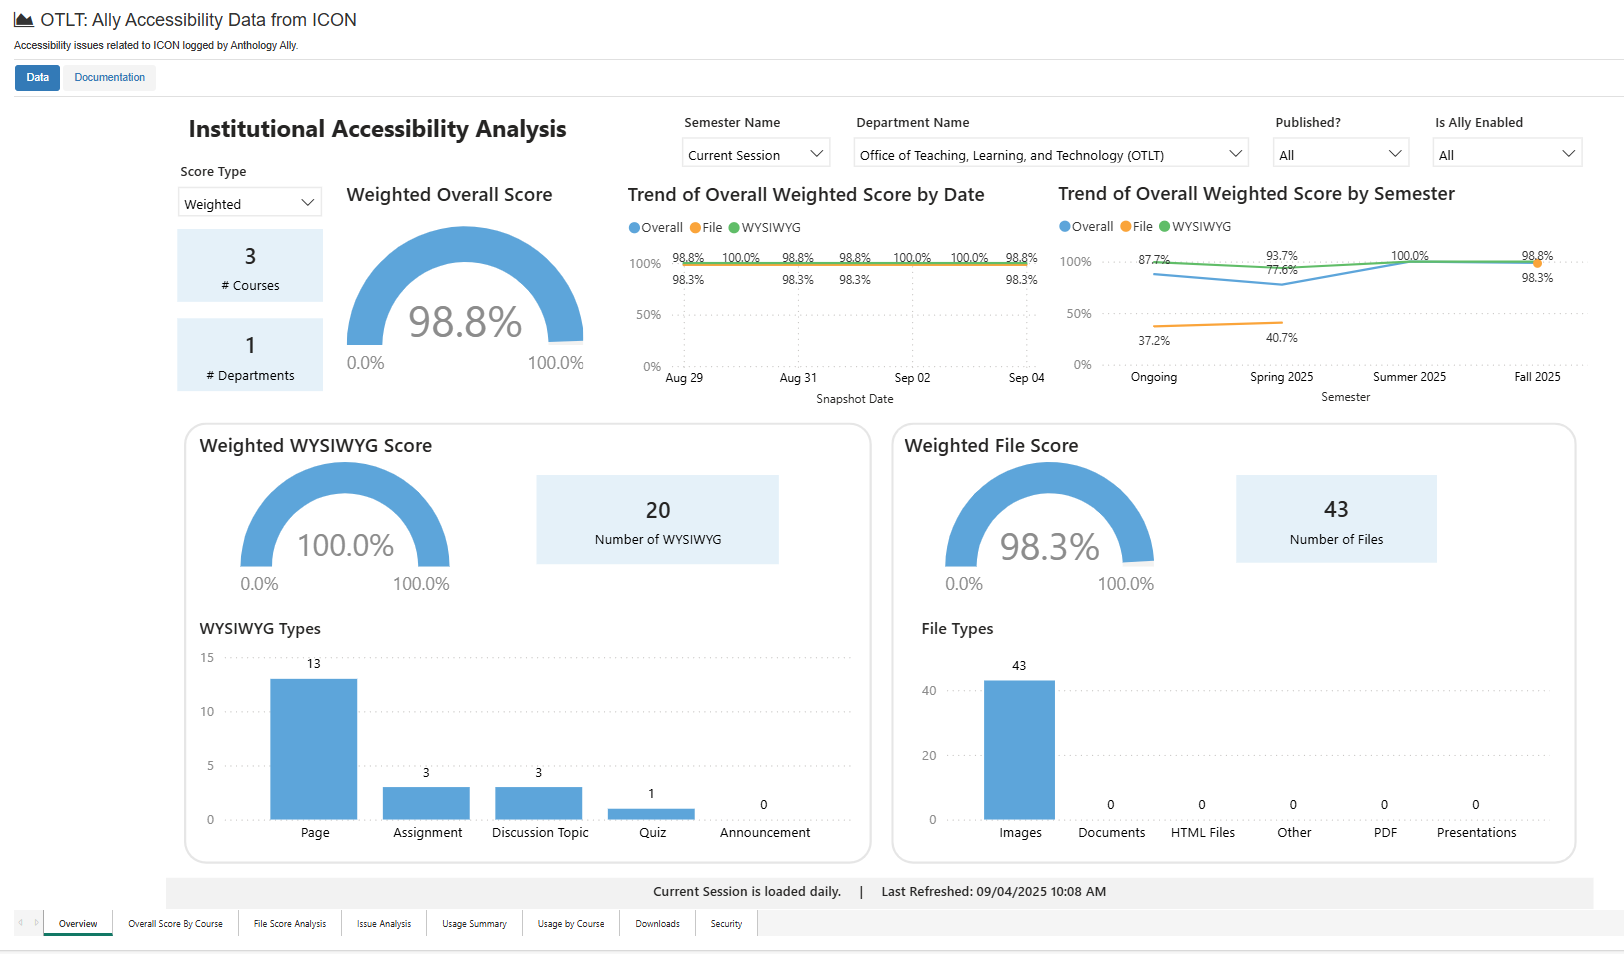
The Overview tab gives a general snapshot of the accessibility status of department course sites.
Filterable by Semester(s), Department(s), and Published State
Provides a count of Departments and Courses with an Overall Score and the trendline chart of Overall Score by Date
Displays separate WYSIWYG and Files Scores with detailed breakdown of file types in need of remediation
Overall Score by Course
The Overall Score by Course tab is useful in identifying high impact courses in need of support.
Filterable by Semester(s), Department(s), and Published State
Sortable table by number of students, overall score, number of files and file score, and WYSIWYG files and WYSIWYG score
File Score Analysis
The File Score Analysis tab identifies range of file types in need of remediation for a department.
Filterable by Semester(s), Department(s), Published State, and File Score Range
Provides a count of Departments, Courses and Files
Filterable display of Files by Type: PDF, Images, Documents, Presentations, HTML
Department Summary Table, sortable by Courses and Files
Issue Analysis
The Issue Analysis tab identifies courses with severe, major, and minor accessibility issues. Ally looks at the number of students impacted, how often the issue occurs, and the accessibility score to determine the priority of the issue.
Provides a count of Total Issues Found and Files w/o Library Reference
Trend chart by Term: Severe, Major, Minor Issues
Sortable tables displaying issues by course, and tables detailing Severe, Major, Minor Issues
Usage Summary
The Usage Summary tab gives a view into the Ally activity for a department.
Count of Course Accessibility Report (CAR) Users and Instructor Feedback (IF) Tool Users
Trend chart of Ally usage by Date
Average Improvement by File Type: Avg. Score Before, Avg. Score After, Avg. Improvement
Usage by Course
The Usage by Course tab gives a view into the Ally course activity for a department broken down by course.
Filterable by Semester(s), Department(s), and Published State
Sortable table by Canvas Course ID, Course Name, Ally tool launches, number of fixes completed, and the average scores before and after remediation
Ally Tools include the Course Accessibility Report (CAR) and Instructor Feedback (IF) Tools
Downloads
The Downloads tab reports the number of times the alternative files have been downloaded from ICON.
Counts downloads by Date, distinct Download Users, and downloads by Format Type: Users, Downloads
Trendline chart by date of downloads by original file type
Security
The Security tab describes what access is allowed for the account logged into the dashboard.
Ally Data Dashboard FAQs
How do I know if my course needs to be remediated?
All courses currently being accessed should be remediated for accessibility issues. This includes past courses where students retain access throughout their academic program, shared sandbox and training courses, blueprint courses, and any other course that has active users accessing it. It does not include personal sandbox and development courses with only one user.
How do I remove sandbox/development courses from the Ally Data Dashboard?
We are in the process of developing a self-service workflow to allow users to request that their sandbox and development courses be archived, excluding them from the Ally Data Dashboard automatically. In the meantime, if you have personal sandbox courses that need to be excluded from the Ally Data Dashboard immediately, please email tier3-icon-support@uiowa.edu to request that the course be flagged for archiving.
How do I remove student access from old courses?
To remove student access from old courses, instructors can go to the course settings and ensure an end date is set for the course. If the Participation is set to Term and the correct term is selected (e.g. Fall 2025, Spring 2026, etc.), an end date is automatically set. If the Participation is set to Course, an end date must be manually added. Once the end date of the course is set, check the box to "Restrict students from viewing course after term end date. Click the Update Course Details button at the bottom of the course settings page to save any changes.